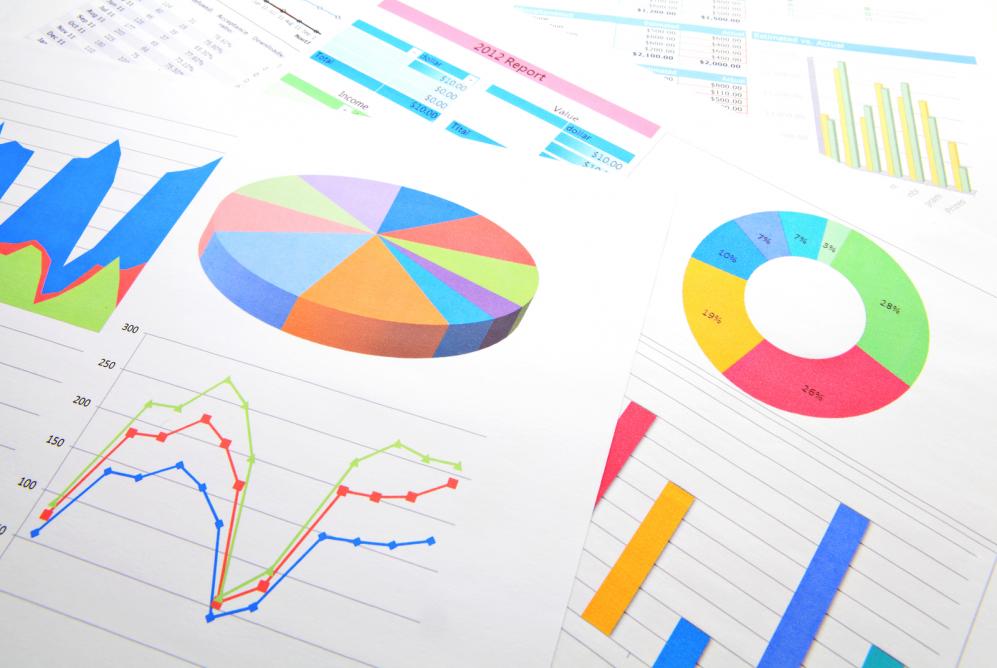
Graphics in both Tableau and Shiny have their pluses and minuses. Tableau is good for drag and drop graphics that is easy to change the types of graphs given the situation with little to no coding. R/Shiny graphics are completely customizable from 3D graphics to violin plots, which is a boxplot that incorporates a probability density function. Also, with Shiny you can get summaries of the data and perform many other advanced statistical methods; beware of running analyses in Shiny without checking the proper diagnostic tests related to the data at hand (this is my statistics background speaking). Where Tableau … Read More
Presidential State of the Union Sentiment Analysis
Sentiment analysis is a hot technology in marketing. This analysis parses comments and feedback left on corporate and social media sites and attempts to discern the tone or attitude expressed by the commenter. For example, reviews and comments about a company’s product such as “I love these shoes” represent a strong positive statement about how the customer feels about that product. The challenge is that the comments are just free-form text in English which computers traditionally had a hard time deciphering. M&S Big Data thought it would be interesting to apply this sentiment analysis to our Presidents. As a start … Read More

