
Selection steps and filters in OBIEE 11g analyses overall serve a similar purpose by limiting the data for the user. Filters are applied before the query is aggregated meaning that it could affect calculations and measures because the query is affected. Whereas selections steps are applied after the query is aggregated meaning that the only thing that is affected is what the user will see, this will not affect calculations and measures. Filters can be applied to attribute and measure columns while selection steps can be applied to attribute and hierarchical columns. The selection steps work incrementally so you should … Read More
A Comparison of OBIEE Drill Downs vs. Hierarchical Columns in 11.1.1.x

Choosing between a hierarchical columns or using a drill down depends on the purpose of the analysis, they both have positive qualities to them. Hierarchical columns allow the user to expand the column to reveal more information on the report but it also gives the option to condense the column back without affecting the selection of the data for the column. If the drill down column is used, the user will not be able to revert back to the original grouping when the dashboard was first opened because it affects both the selection steps and filters. Hierarchical columns will appear … Read More
Custom “No Rows Returned” Warning Message for a Report in OBIEE 11.1.1.x

It is good practice to have uniformity between reports on a dashboard, then it may be a good idea have a particular format for your prompts i.e. having a constant border style and font for each of them. Each report on the dashboard will look similar and it would be easier for a new user to get accustomed to OBIEE and I feel is more aesthetically pleasing. If you design your report to require a user to select prompts before it returns any roles, you may want to consider creating a consistent “no rows returned” message for the users. This … Read More
Using a Dashboard Prompt to Switch Between Analyses in OBIEE 11g

When creating a dashboard to show off your analyses, you will generally make a new dashboard page per analysis. But what if those analyses were similar and could share the same prompt? What if I told you we could use a prompt to switch between those analyses while using other prompts to filter the information simultaneously. Well this is certainly a possibility, below I will create a prompt that will switch between two analyses that have been pre-built for this exercise. In my examples I will be using a modified version of the HR Schema where I have added alias … Read More
When to Use an OBIEE Analysis or BI Publisher Report?
BI Publisher Reports and Analyses are backbone pieces to help meet a business’s BI needs. They are both very flexible for their respective purposes. Being able to combine these pieces on a dashboard in a clear concise manner will give the end users an effective report. [divider] [space height=”20″] [toggle_box] [toggle_item title=”Analysis”] Requires no previous knowledge of the table structure because of predefined subject areas. Gives end users the ability to write ad-hoc reports Can create an analysis from scratch or modify an existing one on a dashboard. Users can save or share their customizations and export to various formats Can be … Read More
Formatting a Field Globally in OBIEE 11g

Some fields will have a standard way of being formatted, such as a date DD-MMM-YYYY or a dollar amount being set $x,xxx.xx. Having to format the field each time that a user wants to use it becomes quite burdensome and gives a developer more room for error if they are formatting the field each time it is used. The saying “work smarter, not harder” comes to mind with this solution. For this example we will globally change the format of the field “revenue” to the format $x,xxx.xx. Let’s open an analysis and for the sake of seeing the format prior … Read More
Misleading Statistics in Internal Developer OBIEE 11.1.1.6.2
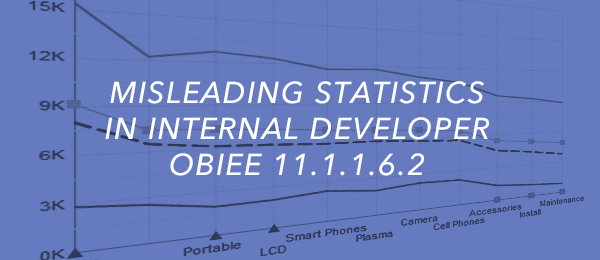
Today, we are going to look at the demo standard deviation charts that come with the internal developer VM OBIEE 11.1.1.6.2. We’ll look at several misleading statistics that are produced with this report and suggest ways to make the page more understandable for the user. Below is the page (1) that we will be investigating. (1) Standard Deviation Page Start with the upper left graph (2), it appears to be using confidence bands on the different factors. One can think of a confidence band as a continuous confidence interval for a linear model. This data is not continuous but consists … Read More
A Kickin’ [Interactive] Map

Mountaineer United Soccer Club (MUSC) came to us with a problem. Not a cloud (SaaS, PaaS, IaaS), big data, Oracle, or enterprise application problem; a different kind of problem. The field maps they had showing off their various soccer fields were very rudimentary with some not-to-scale representations of the play spaces. They lacked visual appeal that people desire when it comes to maps. They asked us to update the maps so so they had a bit more visual interest, so we took on the challenge and did a bit of research. We had some good design ideas for the map.
Before M&S: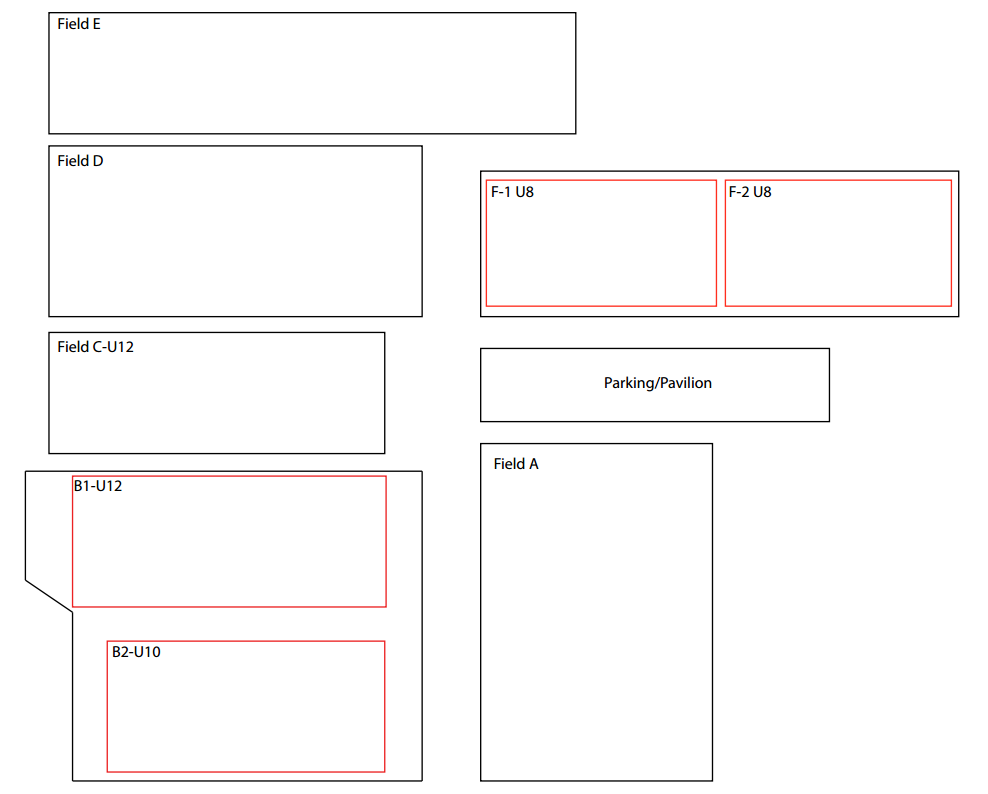
|
After M&S: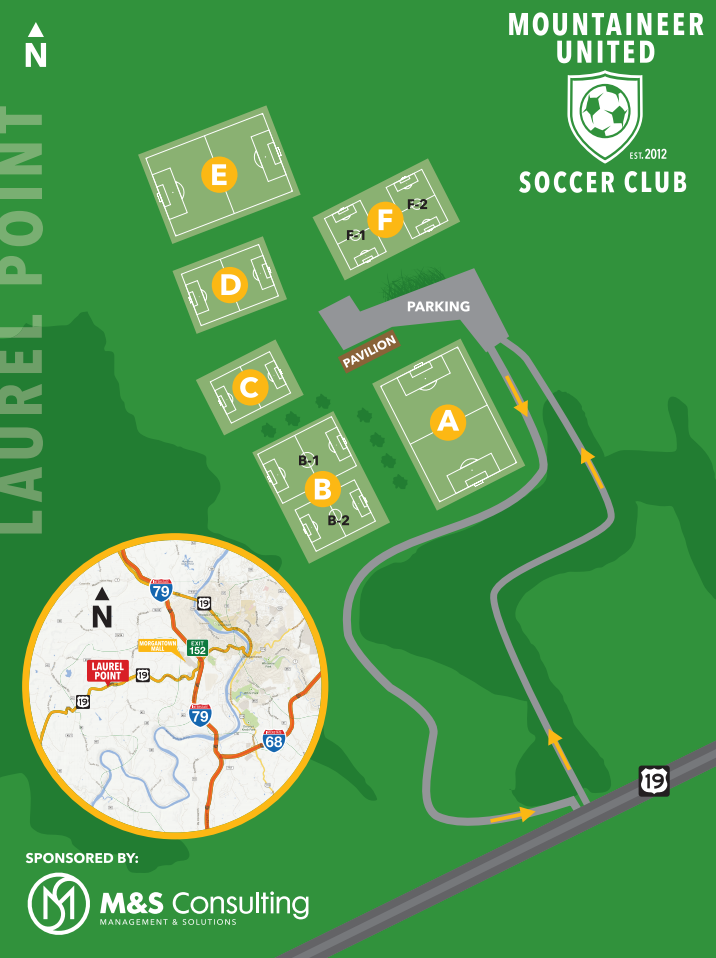
|
[message_box title=”Interactive Map” color=”green”]CLICK HERE for the interactive map.[/message_box]