
The use of a dashboard prompt allows you to embed both the filters from the analysis and the analysis on the same page. Some of the main reasons to use a dashboard prompt are that it allows the user to customize his or her analysis output, allows more flexibility when wanting to change the parameters of a report, and can be reused with different analyses. An inline prompt does not allow these options and navigates the user to see the report within the analysis and not the dashboard. It is much more rigid than the dashboard prompt.
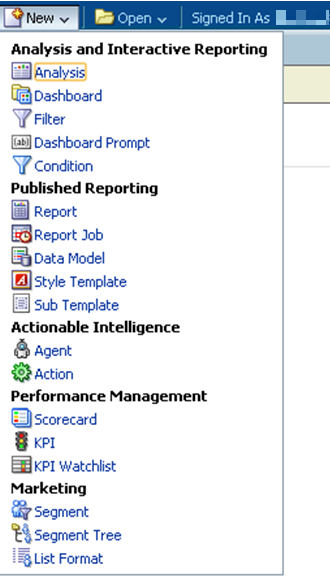
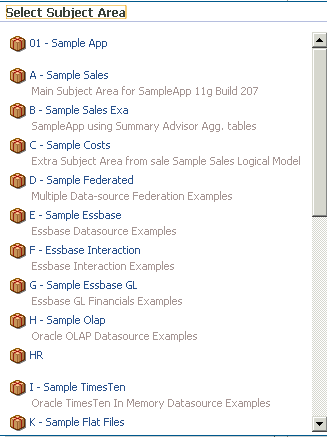
Creating a dashboard prompt is similar to creating the analysis. Select New -> Dashboard Prompt and select the same Subject Area as the analysis.
Once completing these two steps, we are able to prepare the prompt:
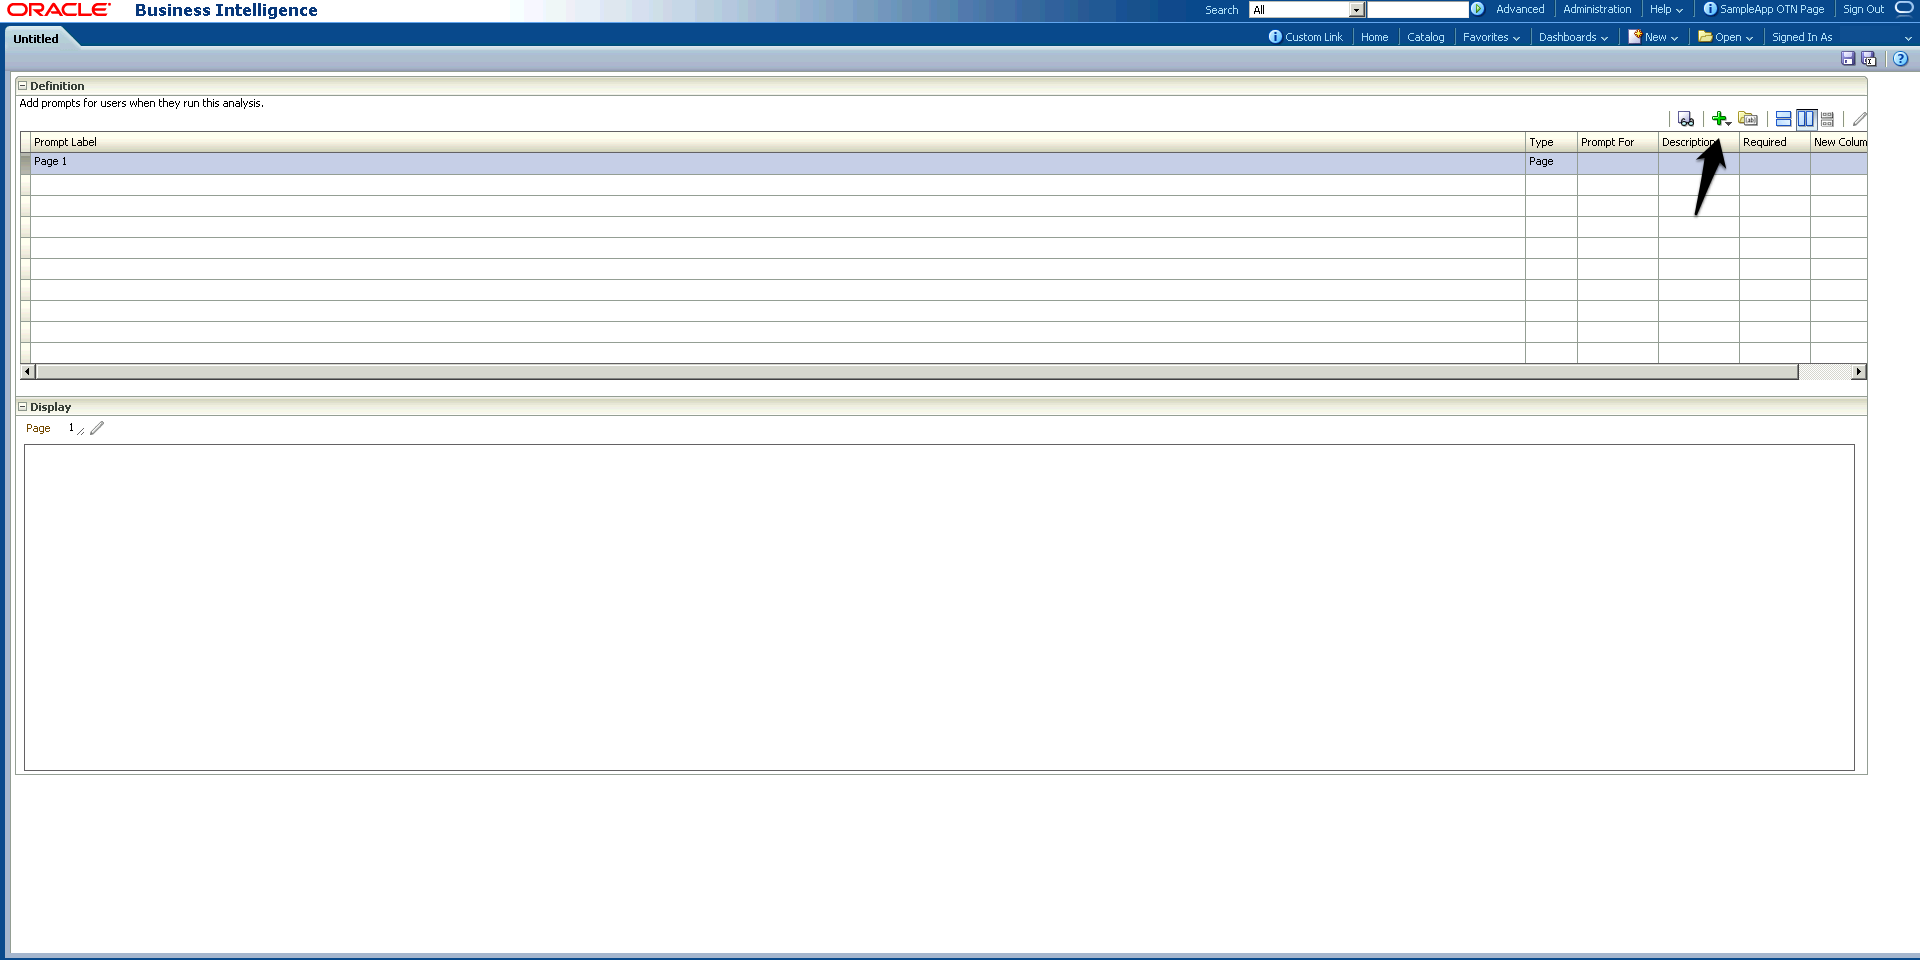
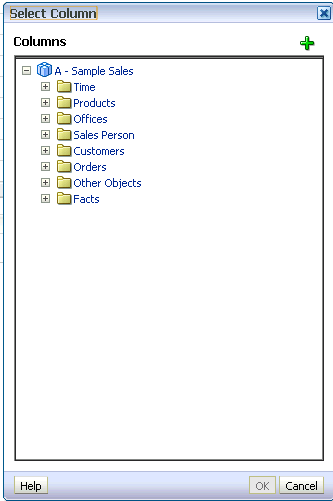
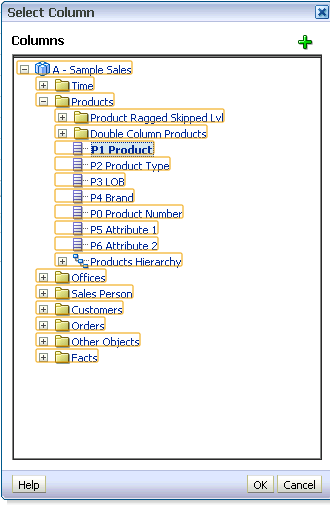
This is the basic view of the Dashboard Prompt; the arrow indicates where you can select the columns to add to the prompted fields on the dashboard. For this exercise, we will only be dealing with “Column Prompts,” but keep in mind different types of prompts may be more appropriate depending on the situation. After selecting “Column Prompts”, you will see “Select Column,” which is equivalent to the “Subject Area” pane, in the analysis where we dragged columns over to build the report:
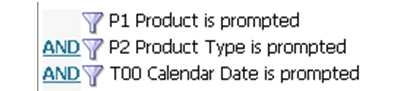
Suppose that we had these three parameters from the analysis:
Select Prompt “Product” from “Select Column”:
Once this selection is made, an option to customize the prompt is available to meet the needs of the report:
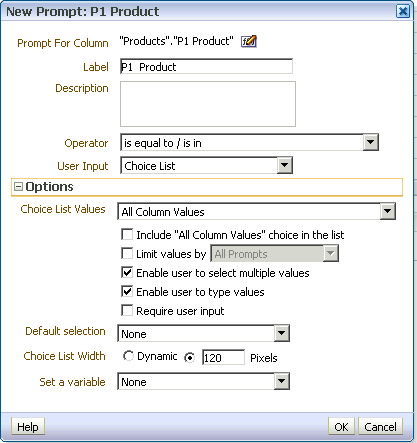
The Operator section gives you various logical operators that you can use to filter the data. “User Input” gives options like a list of values, radio buttons, etc. for the user to be able to pick the data that they want. At list point you can make many changes to the “Choice List Values” you can choose “All Column Values”, “Specific Column Values”, “SQL Results”, “Members of a Group”, or “All Column Values and Specific Groups”.
Formatting the Prompt Area:
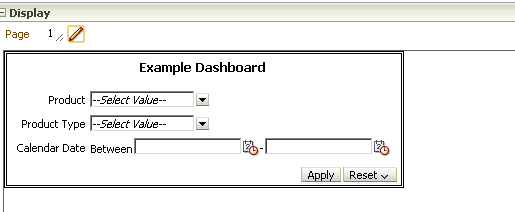
This is what the final product should look like, but notice on the “Display” pane that it is un-formatted and not very pleasing to the eye.

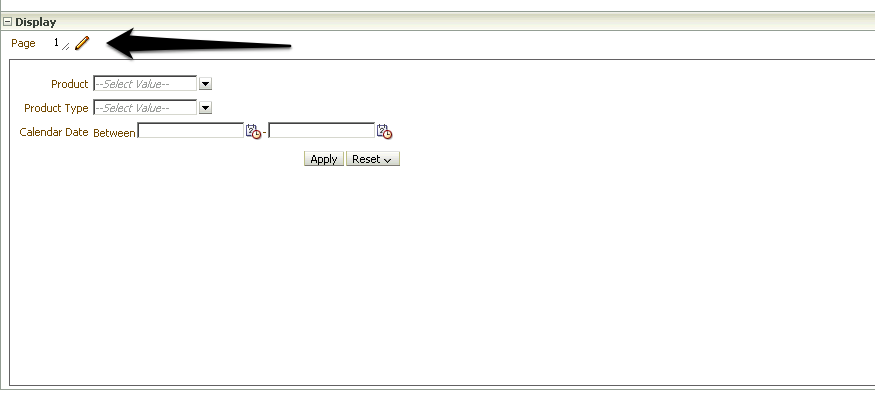
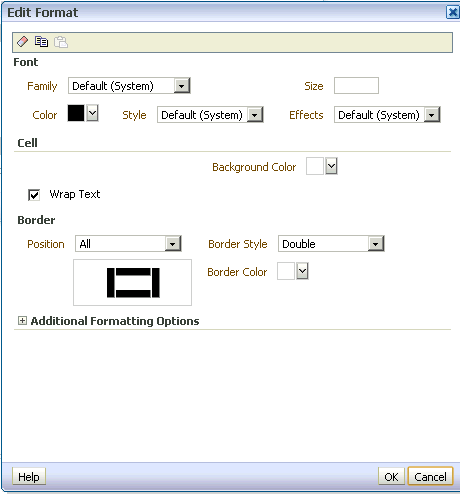
Selecting the pencil will allow you to format the prompt as you would like:

The format section will allow you to change the font, font colors, add borders, etc. I have made those changes to the form below:
Next, add a title. Now, you can see how your prompt with look on the dashboard:
After you apply the formatting to your prompt make sure to save it. Once you’re done with all of that you can place the prompt on the dashboard with the analysis or analyses of interest.